The complete toolset

Every retirement decision, in one connected plan.

Build the details once. Then test retirement timing, spending, Social Security, taxes, Roth conversions, cash reserves, and withdrawals against the same plan.

Full access · No credit card · No account linking
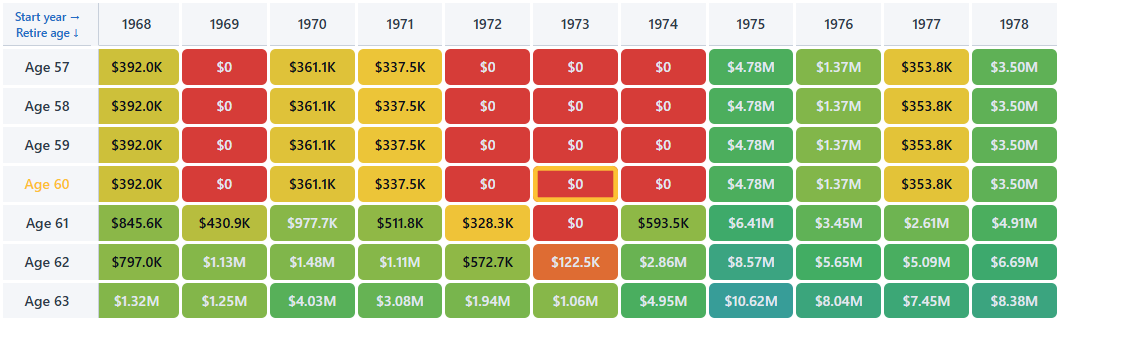
Historical retirement timing heatmap centered on 1973, showing failures and successful outcomes across retirement ages.
1973 sequence cross-sectionSee the same market history fail at one retirement age and recover at another.

01

Build the plan

Model the retirement you actually have in mind.

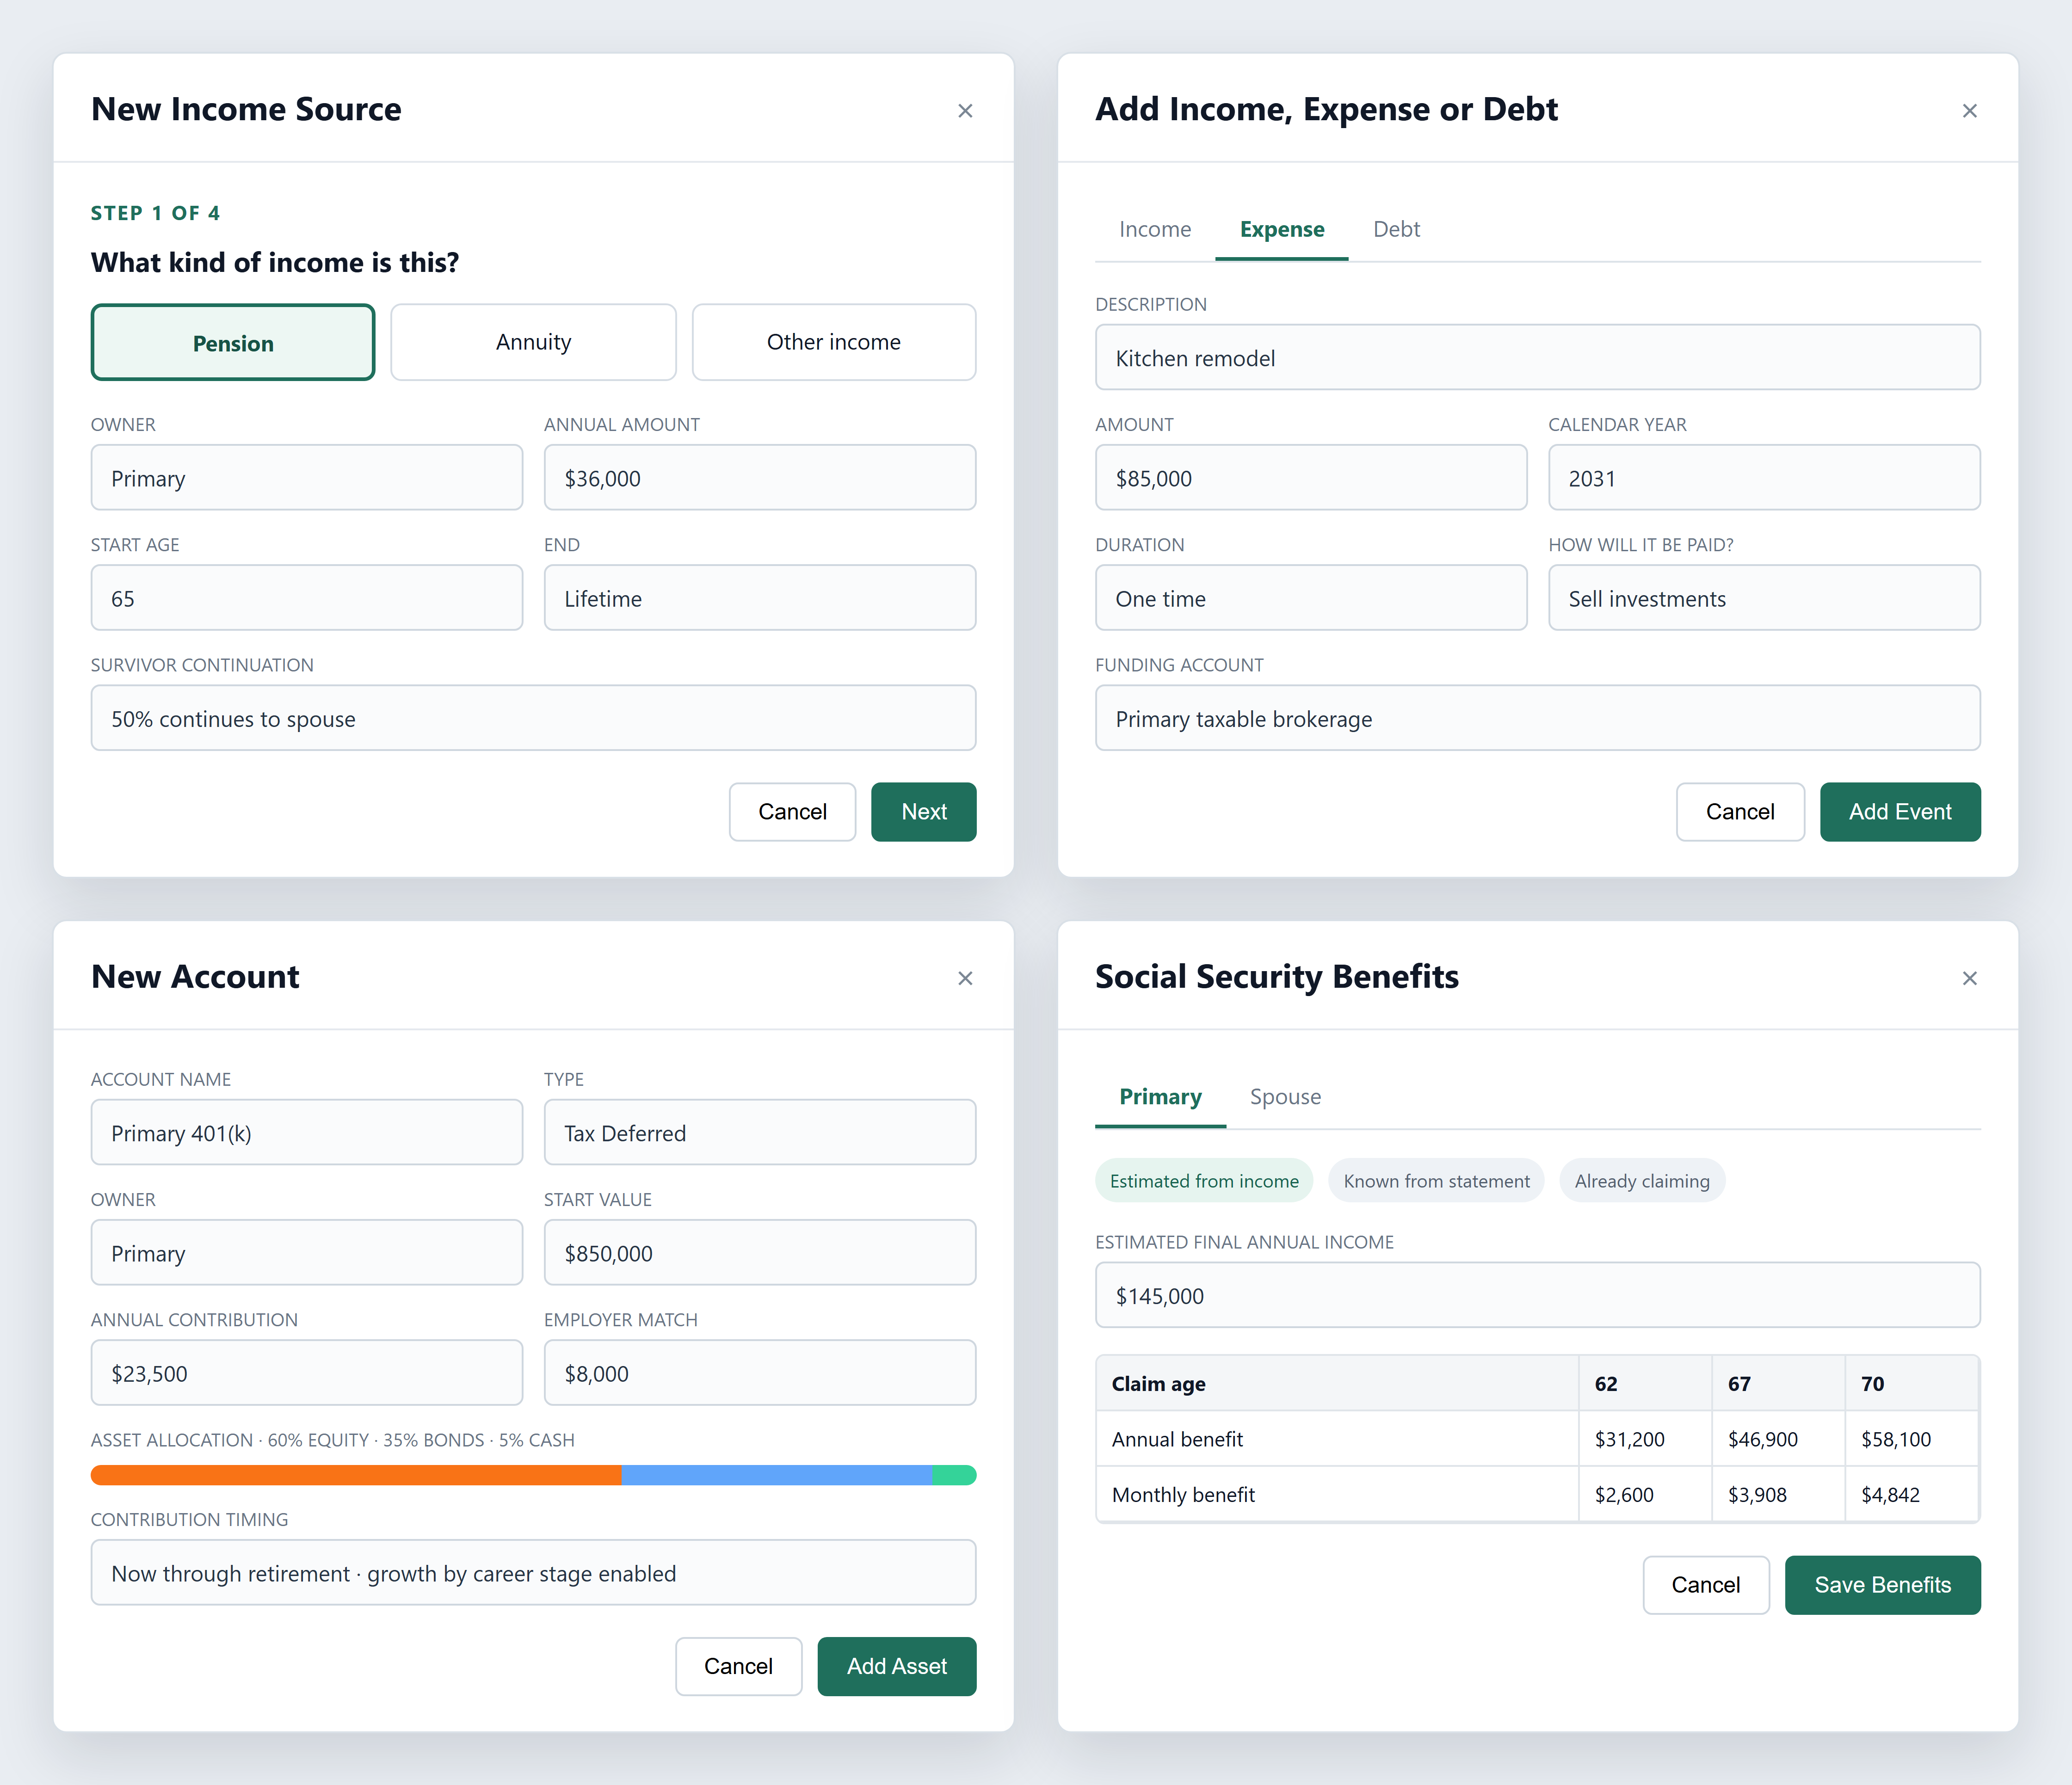
Start with the decisions and life events that shape your plan, from different retirement dates for each spouse to a future move across state lines.

Household timeline

  • Single-person and married-household plans
  • Separate current, retirement, Social Security, and planning-end ages
  • Current and future state of residence, and planned move year
  • Survivor spending after the first spouse dies

Spending and life events

  • Retirement spending in today's dollars
  • Optional retirement spending smile and market-stress reductions
  • One-time or recurring income and expenses by year
  • Inheritances, gifts, college, remodels, weddings, and major purchases
  • Existing loans, financed purchases, and credit-card payoff choices

02

Income and assets

Bring every major source of retirement funding together.

Accounts, guaranteed income, contributions, property, and debt all feed the same year-by-year projection.

Accounts & contributions

  • Multiple taxable, tax-deferred, Roth, and cash accounts
  • Owner, starting value, cost basis, and asset allocation by account
  • Employee contributions and employer matching
  • Contribution growth by career stage
  • Custom contribution start and stop ages, including Coast FIRE

Retirement income

  • Known or estimated Social Security benefits for each spouse
  • Pensions with start age, end age, and survivor percentage
  • Qualified and nonqualified annuities, owned or purchased later
  • Lifetime or term-certain annuity income
  • Other recurring and rental income

Real estate

  • Primary, rental, and investment properties
  • Value, basis, improvements, mortgage, rent, and sale costs
  • Sale at a selected age or year, or automatically for liquidity
  • Custom liquidation order with the primary home sold last
  • Direct sale proceeds to taxable and cash accounts

03

Overview

See the range, understand the risk, and know the next move.

Overview runs the current plan across 112 historical starts. The charts below are the actual rendered canvases from the 94% sample plan.

Plan Success gauge and four Overview summary cards showing 94 percent success, plan assumptions, and median, worst-case, and best-case final portfolios.
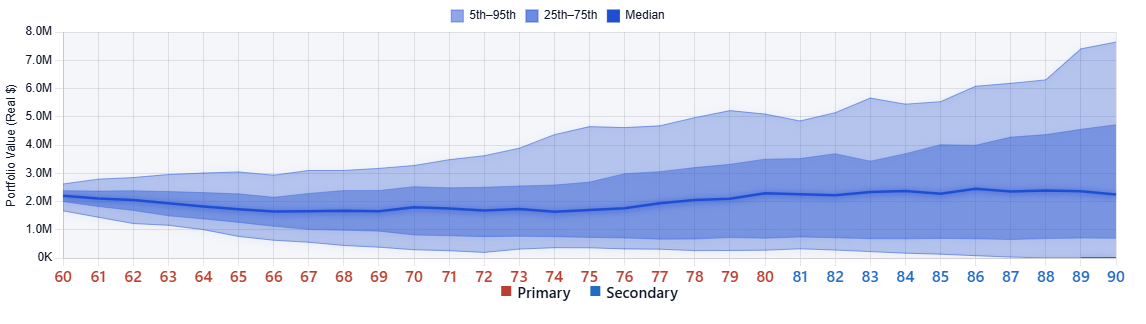
Real Portfolio Projection from the sample plan with historical percentile bands and median path.
Portfolio Projection5th–95th and 25th–75th percentile ranges with the median path.
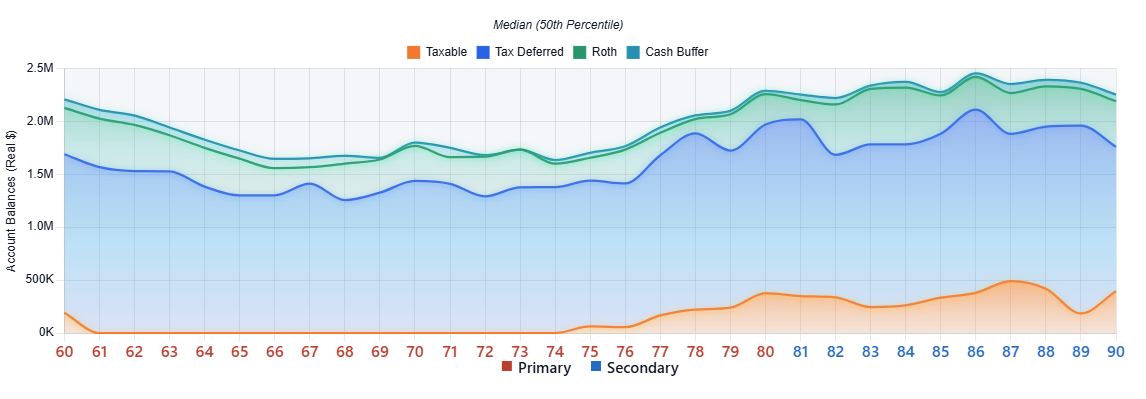
Real Projected Account Balances chart with stacked filled lines for taxable, tax-deferred, Roth, and cash accounts.
Projected Account BalancesStacked account values across the sample plan's full survivor horizon.
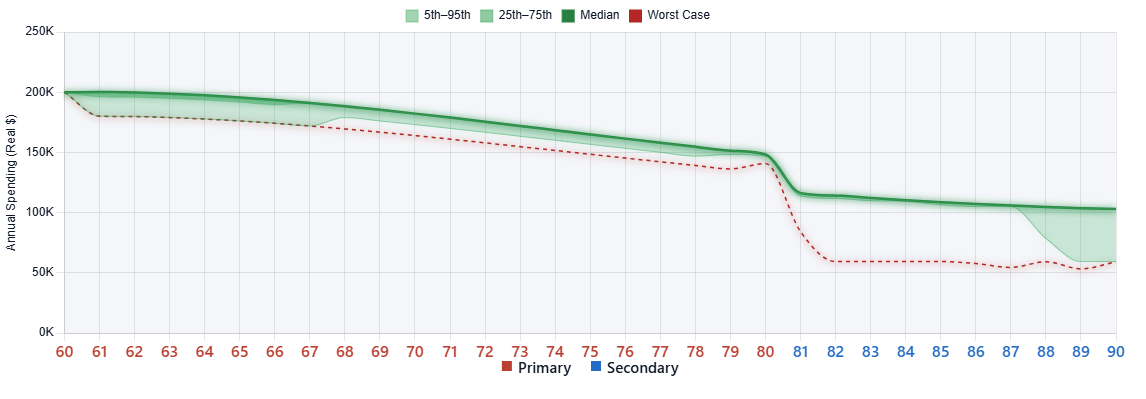
Real Spending Power Projection showing historical ranges, median spending, and worst-case spending.
Spending Power ProjectionTarget spending tested across all historical market scenarios.
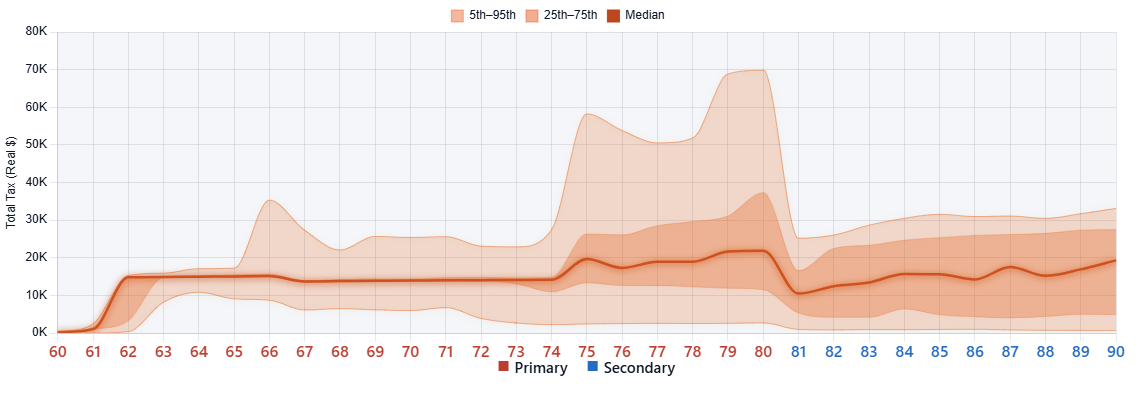
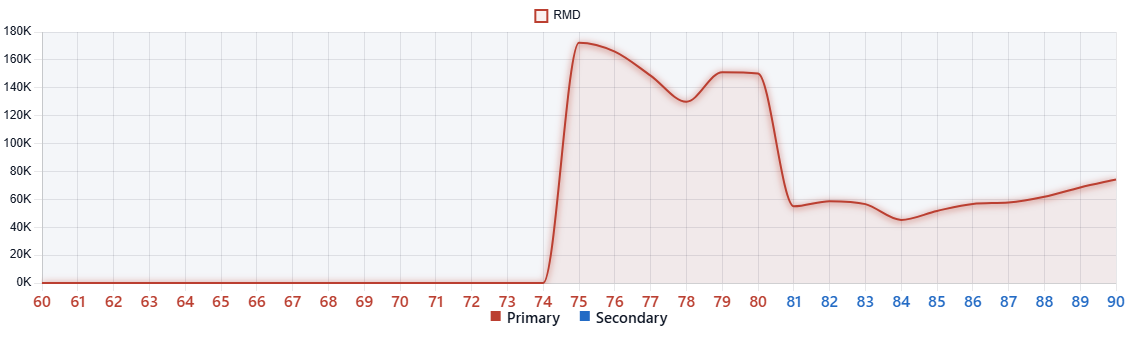
Real Tax Burden Projection showing historical percentile bands and median annual tax.
Tax Burden ProjectionAnnual tax ranges, including RMD and conversion effects.
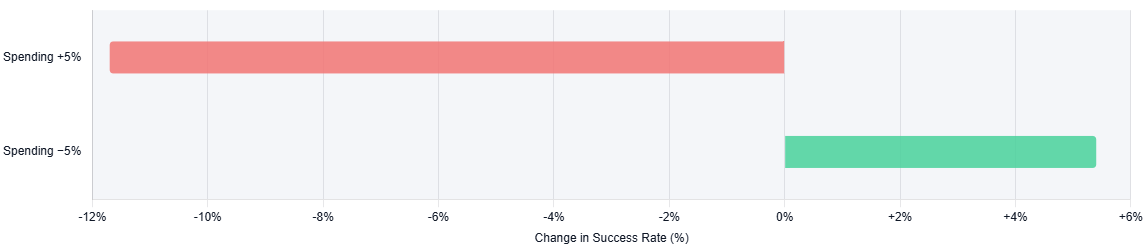
Real Sensitivity Analysis card for the sample retirement plan.
Sensitivity AnalysisSee which tested changes move plan success the most.

Historical Modeler

Open any market history and inspect the full plan year by year.

The heatmap finds vulnerable retirement dates and return sequences. Selecting a cell opens the balances, funding sources, account composition, taxes, healthcare, RMDs, and cash behavior behind that outcome.

Real Retirement Timing heatmap centered on 1973, with the age-60 failure selected and later retirement ages producing stronger outcomes.
1973: one sequence, sharply different outcomesAge 60 depletes the portfolio; later retirement ages range from near-failure to materially stronger endings.

1973 held constant

Change only retirement age and the outcome changes dramatically.

The selected age-60 plan depletes in the 1973 sequence. Moving down the same column reveals how a few years of timing can shift the result from failure to a seven-figure ending.

  • 112 historical starting years
  • Retirement-age sweep
  • Funding outcome and ending assets
  • Fixed-return alternative for assumption testing

Two views, two purposes: the heatmap holds 1973 constant to expose the full retirement-timing cross-section. The detailed Historical Modeler and Taxes & Healthcare charts use the representative 1985 scenario.
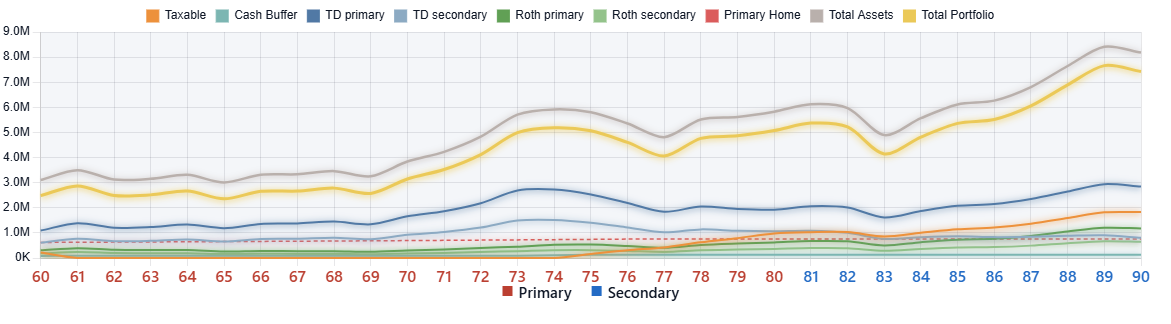
Real Balances Over Time line chart for the selected historical sequence.
Balances Over TimeAccount and property balances for one selected market history.
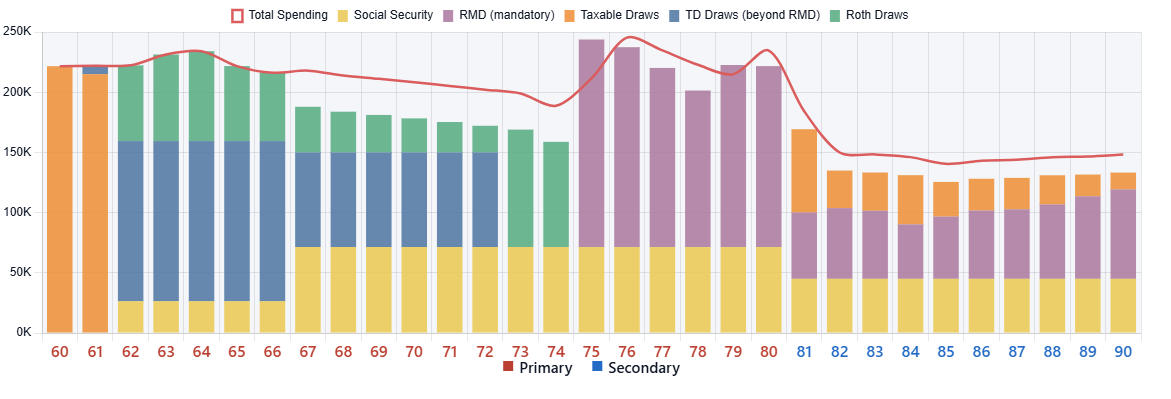
Real Income Sources Over Time chart for the selected historical sequence.
Income Sources Over TimeGuaranteed income and portfolio funding across retirement.
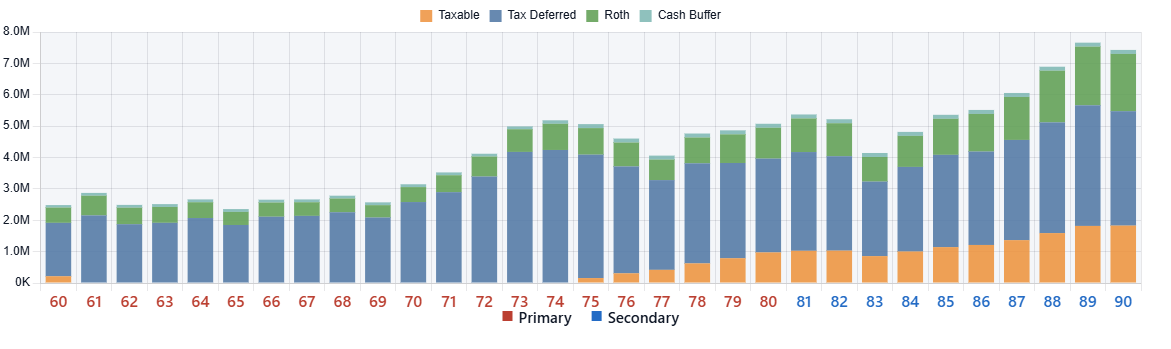
Real Portfolio Composition by Year stacked bar chart.
Portfolio Composition by YearHow taxable, tax-deferred, Roth, and cash balances change.
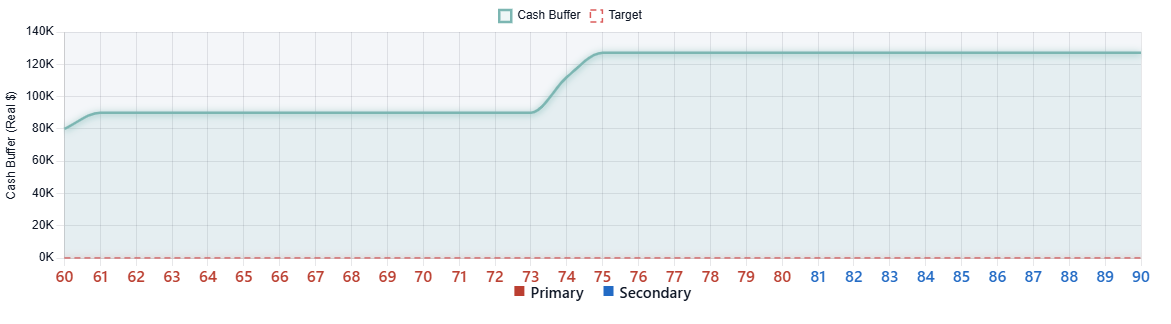
Real Cash Buffer filled line chart with its target line.
Cash BufferBalance, target, drawdowns, and refills year by year.
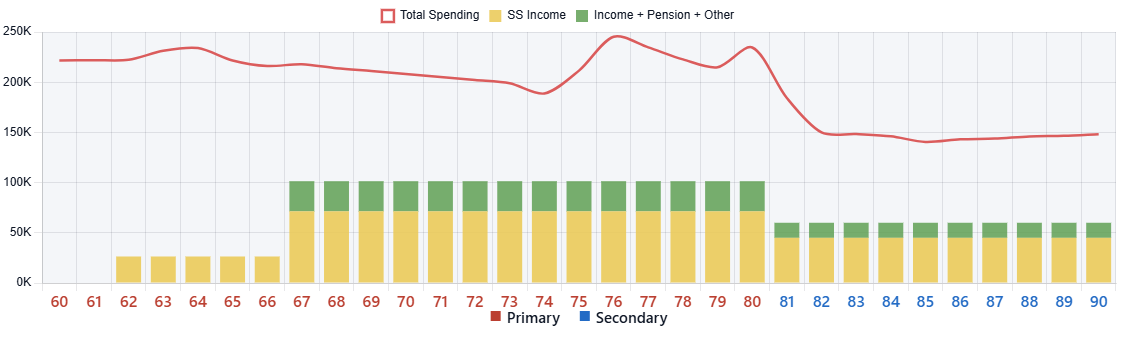
Real Income Sources versus Spending chart.
Income Sources vs SpendingAnnual income sources compared with the plan's spending need.
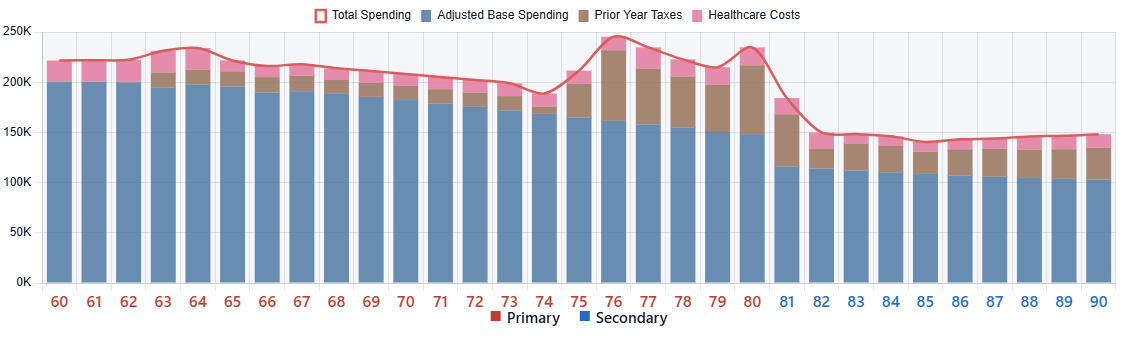
Real Spending Breakdown chart with base spending, taxes, healthcare, and one-time expenses.
Spending BreakdownThe components that make up each year's total spending.

04

Decision tools

Move from “Will it work?” to “What should I change?”

Each tool uses the plan you already built. Recommendations come from tested outcomes, not a generic checklist.

Analyze

Rank retirement-age, spending, and contribution changes by how much each improves the plan.

Social Security optimizer

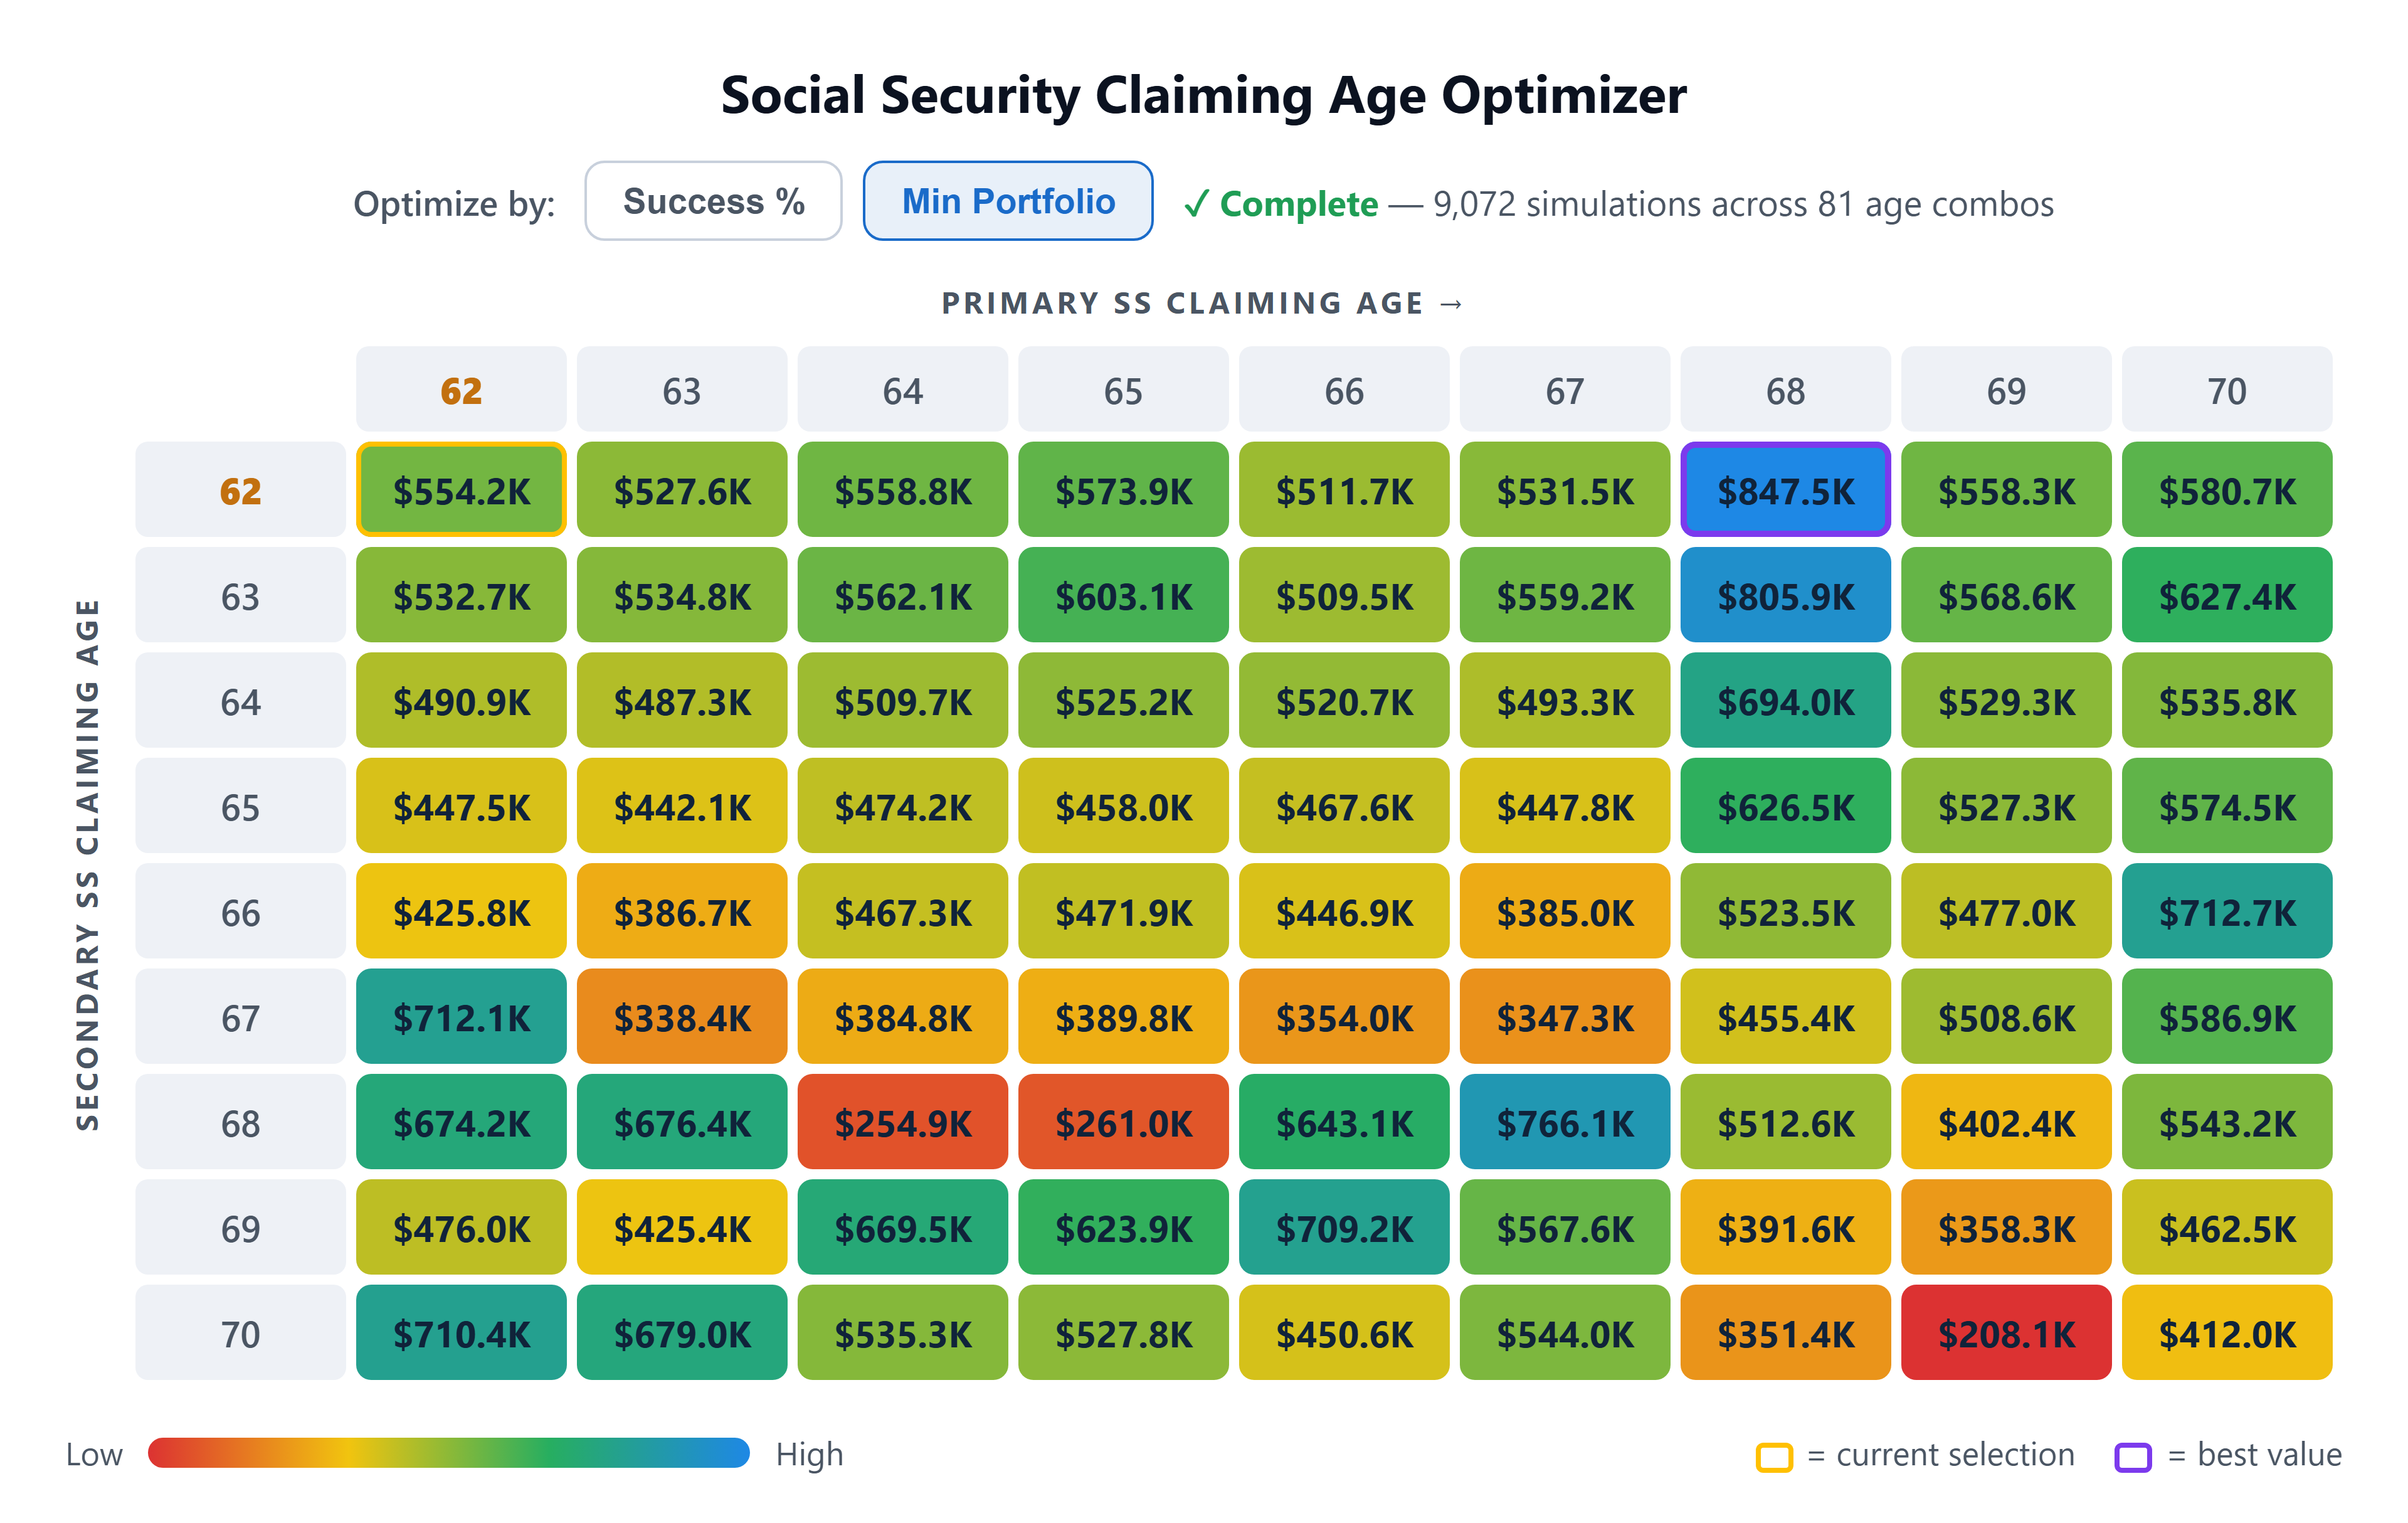
Test joint claiming-age combinations and identify the strongest household strategy.

Roth conversions

Compare conversion strategies, lifetime tax, RMDs, and after-tax ending wealth.

Cash reserve

Test reserve sizes and configure drawdown, refill, return, and sunset rules.

Near-term action plan

See a three-year withdrawal plan and annual Roth-conversion schedule when relevant.

Policy controls

Use automatic or manual withdrawal order, Roth-conversion, and cash-buffer policies.
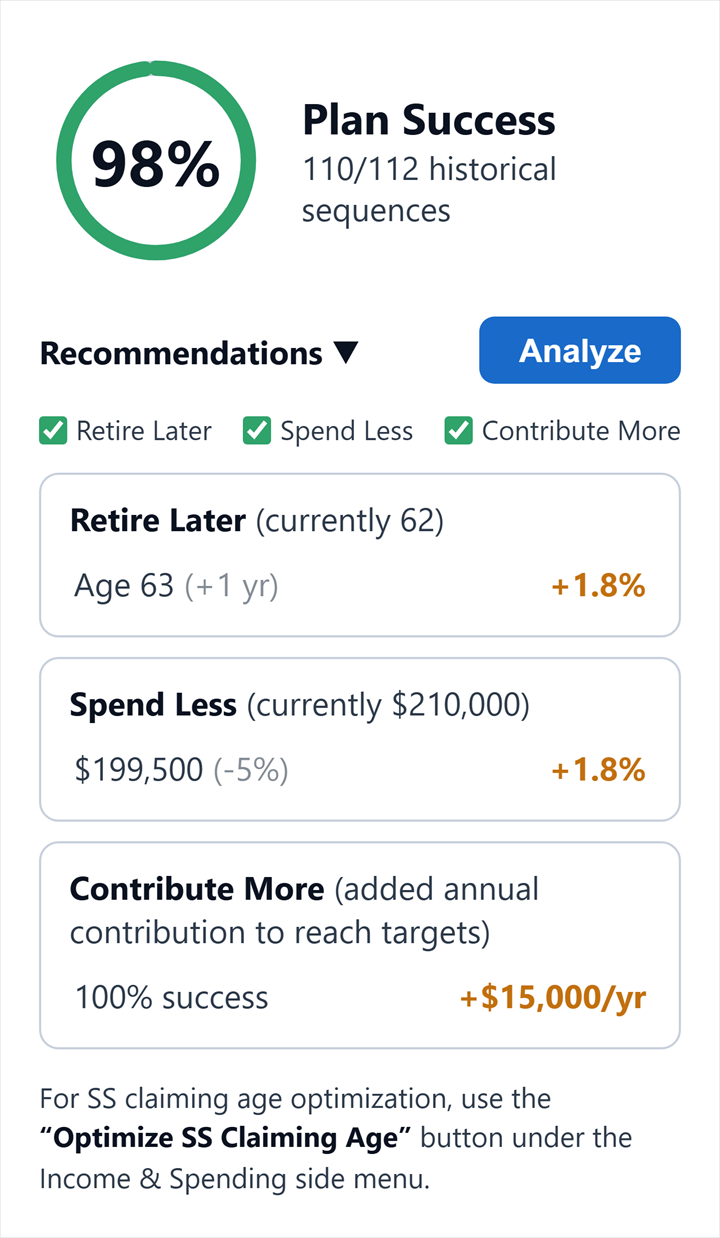
Analyze panel showing a success gauge and ranked retirement recommendations.
Analyze recommendationsApply tested changes directly to the plan.
Social Security Claiming Age Optimizer heatmap comparing joint claim ages.
Social Security Claiming Age OptimizerCompare every eligible joint claiming-age combination.

05

Taxes and healthcare

Model the costs that simpler plans leave outside the spending number.

  • Federal ordinary-income and capital-gains tax
  • Social Security taxation and net investment income tax
  • Required minimum distributions
  • State income-tax modeling for all 50 states and Washington, D.C.
  • Tax changes after a planned interstate move
  • Pre-Medicare insurance, Medicare Parts B and D, and Medigap
  • IRMAA tiers and income-related surcharges
  • Tax-bracket, annual tax, healthcare, and RMD charts
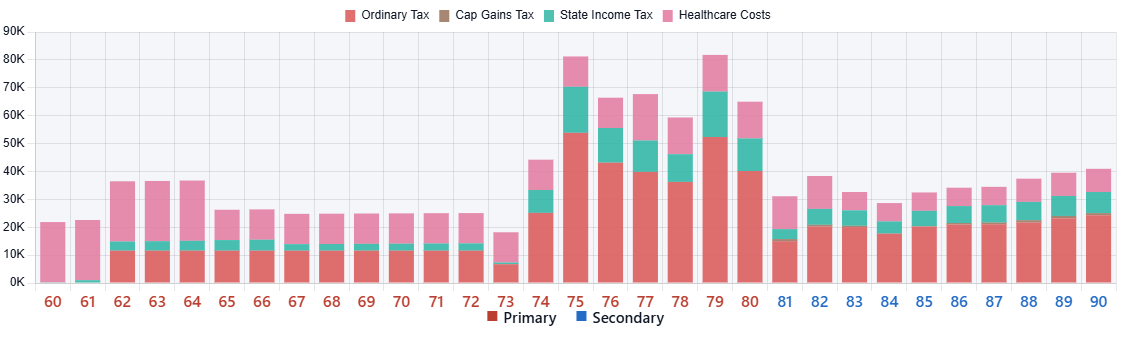
Annual Tax Burden and Healthcare Costs chart for the representative 1985 historical scenario.
Annual Tax Burden and Healthcare CostsOrdinary, capital-gains, and state tax beside healthcare costs.
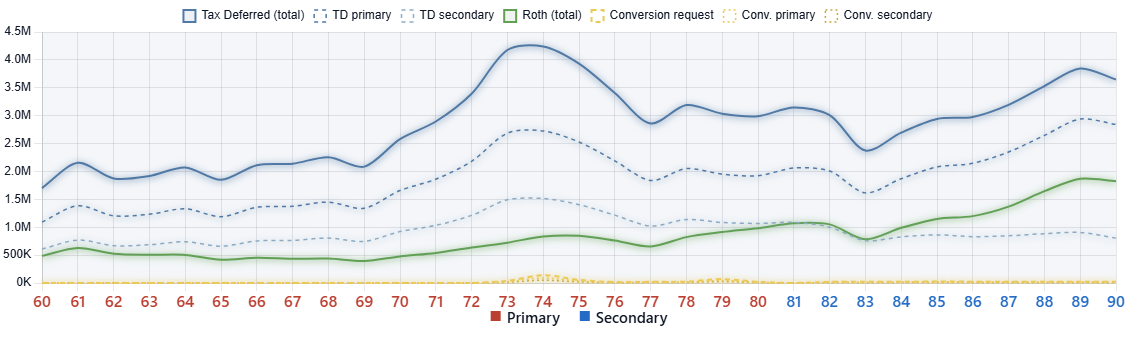
Tax Deferred versus Roth chart for the representative 1985 historical scenario.
Tax Deferred vs RothTax-deferred and Roth balances, ownership, and conversion requests over time.
Required Minimum Distributions chart for the representative 1985 historical scenario.
Required Minimum DistributionsAnnual mandatory withdrawals without fill overshoot artifacts.
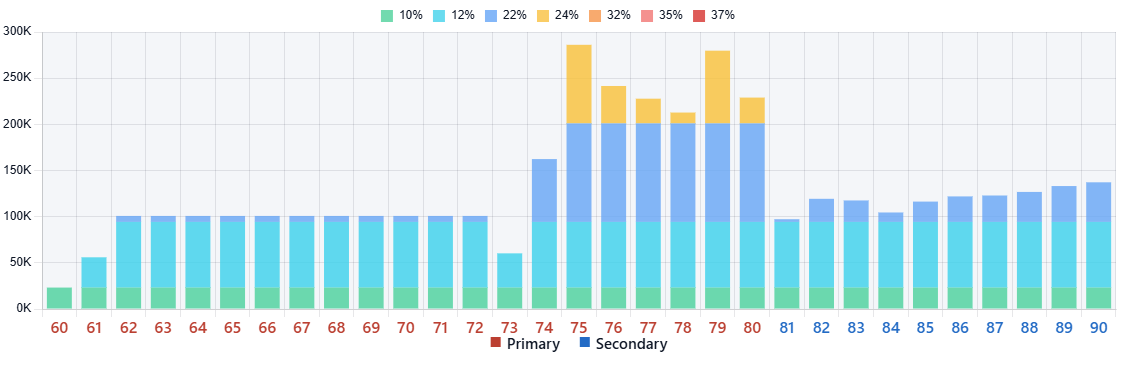
Tax Bracket Utilization chart for the representative 1985 historical scenario.
Tax Bracket UtilizationHow much of each federal bracket is filled each year.
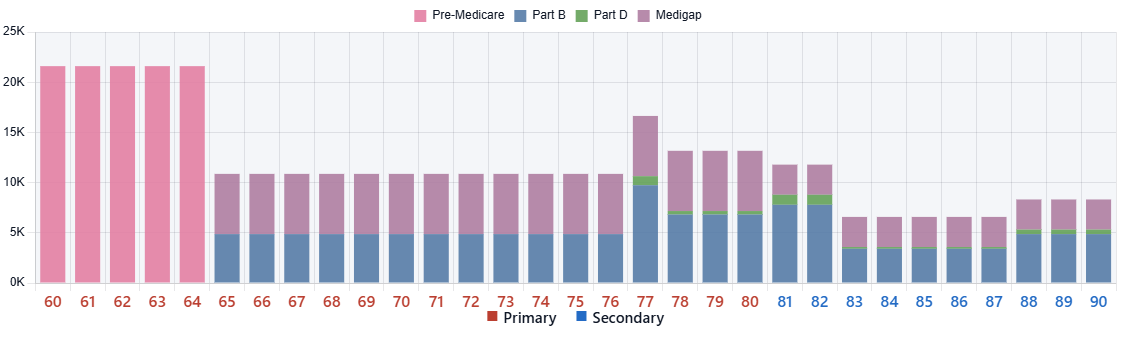
Healthcare Costs chart for the representative 1985 historical scenario.
Healthcare CostsPre-Medicare, Parts B and D, Medigap, and IRMAA costs.

06

Scenario comparison

Put competing choices on the same screen.

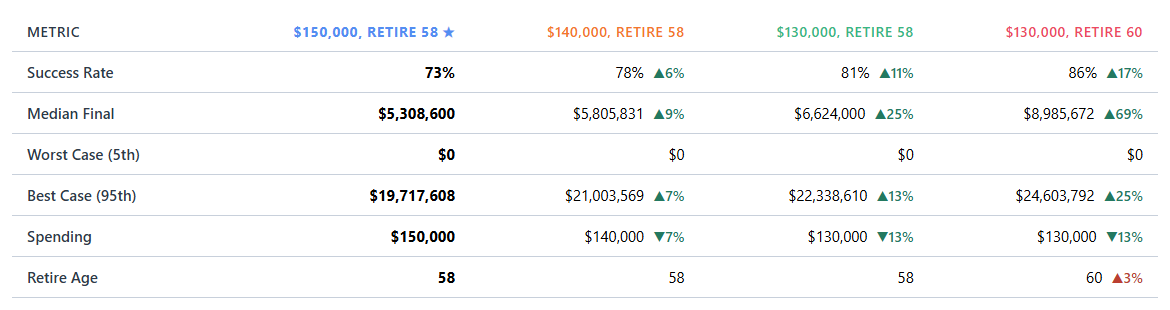
Save a plan before you change it, then compare the outcomes and the exact inputs that made them different.
  • Save and name complete plan scenarios
  • Compare success, ending assets, spending, and retirement age
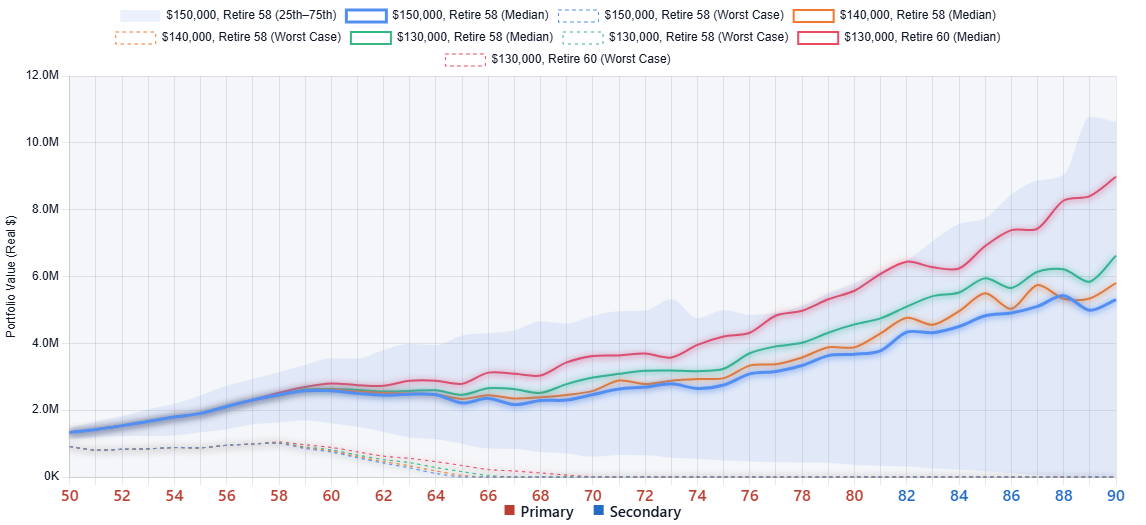
  • Overlay median and downside portfolio paths
  • Show only the inputs that differ
  • Choose a custom comparison baseline
  • Archive, restore, rename, reorder, and delete scenarios
What-If Metrics Comparison table for four saved retirement scenarios.
Metrics ComparisonSuccess, ending portfolios, spending, and retirement age versus the starred baseline.
What-If Portfolio Projection Overlay for four saved retirement scenarios.
Portfolio Projection OverlayMedian and worst-case paths with the baseline's 25th–75th percentile range.
What-If Input Differences table showing the inputs that changed across four saved scenarios.
Input DifferencesOnly changed assumptions are shown, with differences from the starred baseline.

07

AI retirement assistant

Ask about your plan. Get an answer grounded in it.

The assistant reads the plan already on screen, so the conversation starts with your actual results, assumptions, accounts, and enabled strategies instead of generic retirement advice.
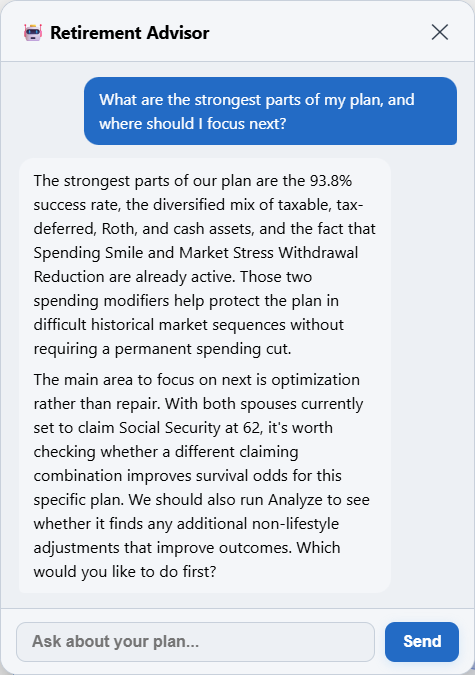
  • Answer questions using the current plan
  • Explain charts, results, and plan mechanics
  • Recommend the most relevant analysis tools
  • Apply input changes after you approve them
  • Ask follow-up questions without leaving the dashboard
  • Keep recommendations focused on the software
ModelRetirement AI assistant answering a question using the sample plan's 93.8% success rate, account mix, and enabled strategies.

08

Results and guidance

A detailed model, translated into a plan you can use.

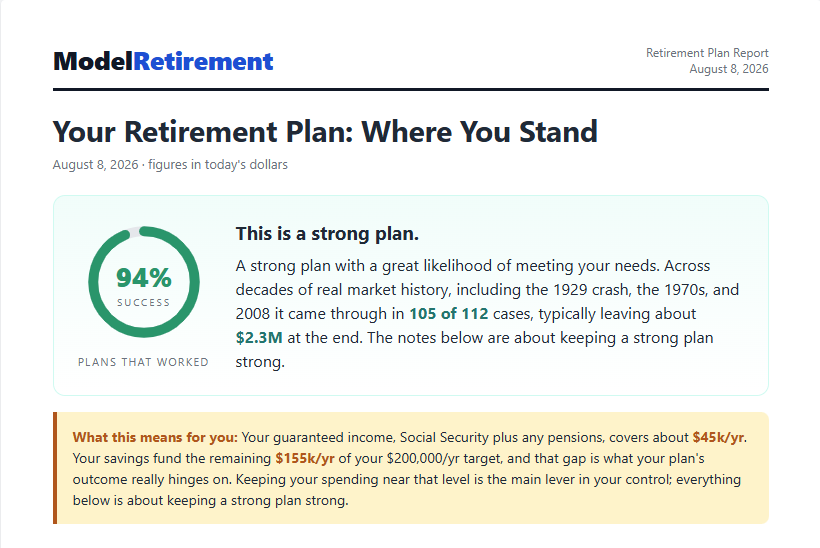
The dashboard keeps the evidence close. The downloadable report turns the same analysis into a plain-English summary of where you stand, what to do, and why.
  • Plan-success gauge and summary metrics
  • Portfolio and account-balance projections
  • Income, spending, withdrawal, tax, and healthcare charts
  • Contextual field help and chart explanations
  • Plain-English retirement plan report
  • Ranked Social Security, Roth, and cash-reserve evidence
  • Three-year withdrawal and conversion schedules
  • Client and advisor report formats
View full sample client report
Plain-language retirement plan report with a plan-strength gauge and recommendations.
Downloadable retirement plan report

Built for a focused planning session.

  • Guided first-time setup
  • Automatic plan saving
  • Light and dark themes
  • Adjustable interface scale
  • Restartable walkthrough
  • Erase saved plan data anytime

Your numbers. Your decisions.

See what the full toolset finds in your plan.

Build a complete plan free, with no credit card and no account linking.

Start planning